CONTAMINANT SIMULATION (Steady State)
Steady State Contaminant simulation allows tracking the concentration of contaminants through a ventilation model. Ventsim Visual™ has a number of different types of contaminant simulations to enable users to predict the paths of any sort of gas, dust, smoke, stench gas or even fresh air through a mine, and may assist in emergency planning, production design, and to improve blast clearance times.
Simulation of contaminants through underground mines can be difficult to predict, particularly if simulations are required to take into account the complex boundary and mixing behaviours of contaminants traveling through a three dimensional airway.
Ventsim Visual™ uses a relatively simple algorithm which distributes contaminants in a linear velocity fashion, and assumes perfect mixing at intersections. This method is considered suitable for high level studies through broad mine areas, but is not recommended for analysis of contaminant diffusion on a small scale level. In this case a computational fluid dynamic simulation may be better suited.
A number of different simulation techniques are offered to provide users with a host of tools to analyse the tracking of air and contaminants through a mine. Contaminants can either be specified as an in-line concentration of contaminant within the airway, or they can be injected into an airway using a surface connected airway to represent an external gas source (see the Gas Simulation section for further information on this method)
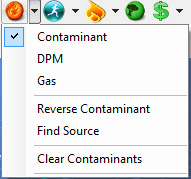
Performs a steady state (continuous) contaminant simulation based on the position of contaminant source(s) placed in the model.
Steady state simulation simulates the spread of contaminants until such time as the contaminant spreads through all possible pathways, and contaminant levels have stabilised to a ‘steady state’. Where recirculation may be present, the simulation will continue until the recirculated air has reached equilibrium concentration. The simulation will only show result when ‘steady state’ conditions have been achieved.
Upon completion, the view will switch to a contaminant view of the final results with airways coloured according to concentration of contaminants. The contaminant spread time can also be selected as a colour or data text option, however this function will only provide the time that the contaminant first reaches an airway location, not the specific concentration of contaminant at that time. For calculating contaminant concentration at a particular time, the Dynamic Simulation function will need to be used.
Contaminant can be placed in a model by using the Edittoolbar function and selecting the Contaminant Tab, or the Contaminant toolbar button![]() . Contaminant strengths are volume unit based and can be entered either as a proportional unit base, or a volumetric gas concentration.
. Contaminant strengths are volume unit based and can be entered either as a proportional unit base, or a volumetric gas concentration.
EXAMPLE Entering ‘100’ as a concentration value may indicate 100% of the original contaminated source strength in an airway, and will result in the dilution of the value as uncontaminated air is mixed downstream. In this case, a downstream value of ‘25’ downstream would indicate 25% of the original contamination strength.
Another example of entering ‘2000’ may indicate an initial value of 2000 ppm of CO gas. Downstream values would show diluted concentrations of this value. The units name does not need to be changed, however if desired can be changed in the Settings > Contaminant menu.
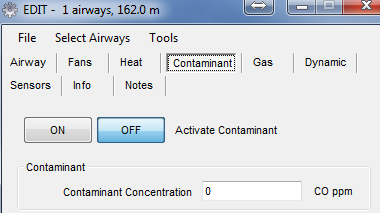
The contaminants may be cleared by pressing the Clear button at the base of the contaminant sub-menu.
Simulates a steady state flow of diesel particulates calculated from diesel heat sources placed in the mine. For further information on this function, see the DPM simulation section.
Simulates a steady state flow of multiple gases defined as sources in one or more airways. This is similar to contaminant simulation, but volumetrically simulates many different types of gases simulataneously. For further information on this function, see the GAS simulation section.
Reverse Contaminant Determines the source of air at a specific location.
A sourcing simulation is similar to a reversed contamination simulation. It tracks airflow back from a placed contaminant source, and indicates the percentage of airflow which contributes to the airflow through the contaminant marker. This function is useful in determining where a location sources its fresh air from, or for analysing ways to reduce or increase airflow sources from certain areas (such as increasing airflow sourced from a bulk air cooler or decreasing airflow sourced from a hot production area.)
EXAMPLE: Entering ‘100’ as a concentration value and performing an ‘air sourcing’ simulation will show which airways upstream are carrying the relative amounts into the original airway. Back tracking the concentrations to the surface will show which surface airways are providing the airflow and may show values such as (for example) 25% decline adit, 60% main vent shaft, 15% hoisting shaft.
Find Source Assists in finding the location of a contaminant source.
This simulation function was designed to assist in quickly identifying the possible locations of a fire or contaminant source (e.g. dust or production fumes) underground. As people report the status of air from different locations (for example smoky air or clear air), the simulation will colour airways upstream and downstream as either smoke (red), blue (clear) or yellow (possible smoke source)
Contaminant reports can be placed by selecting the location tool bar button under the contaminant button. A RED pin can be placed to designate a contamination report. Ventsim will assume that all airways downstream from this report will also be in smoke (coloured red) and all airways above the report will be a possible source of smoke (marked in yellow). The BLUE pin indicates clear air. Ventsim will assume that all airways upstream from this point are in fresh air (coloured blue). Once reports are place, select the location simulation function to simulate and colour the airways around the reports.
As more reports are received, the YELLOW possible smoke source areas will decrease and the location of a fire or contaminant source can be narrowed.
EXAMPLE Mine Control receives a radio report that smoke has been smelled in a decline location. Checks reveal that other personnel further up the decline cannot smell any smoke.
The vent officer places a ‘REPORT SMOKE’ tag on the airway where smoke was reported and a ‘REPORT FRESH’ tag on the clear airways. Pressing LOCATION SIM will show the likely paths of the smoke in RED, what areas are likely to be fresh in BLUE, and what airways may be the source of the SMOKE in YELLOW.
After receiving two more reports of smoke in different areas and fresh air in other areas, the simulation suggests the smoke could only be coming from a workshop area in the mine. The vent officer directs emergency personnel to that area, who find a large number of smouldering rags in an industrial waste bin.

For intense or hot fires, it is not recommended to use the contaminant functions for fire simulation. Hot fires produce significant expansion of airflow and natural ventilation pressures which can change flow quantities and even directions, thereby rendering conventional contamination simulation models inaccurate.
For small fires, or perhaps the initial phases of a larger fire, contaminant distribution may still be a useful way to model smoke concentration and direction through a mine.
For larger fires, it is recommended to use the Ventsim 3.0 Premium VentFIRE™ function which has specific simulation methods for distribution of hot gases, smoke and heat from fires, and can assist in simulating the dynamic changes to the ventilation system.